

In this article, we look at public aggregate data from the Reserve Bank of India (RBI) on credit pricing and glean aggregate trends from it.
Retail credit today comprises collateralised lending from banks and NBFCs (vehicle and housing finance, loans against property, gold and securities), credit cards and other unsecured credit to those with good credit scores among salaried segments1, microfinance lending (to self-Help Groups and Joint Liability Groups) by NBFC-MFIs, non-MFI NBFCs, banks and NGO-MFIs), and other forms of personal loans. These form the primary formal credit infrastructure for individuals and households today. In recent years, this credit landscape has been further transformed by the entry of fintech lenders, who have become significant credit suppliers in the small-ticket personal loan market (see Figure 1).

RBI data on interest rate ranges for bank credit3 is an important source that can provide insights on the pricing of bank loans in India. It paints an interesting picture across five 'organization-wise' classifications for which data has been provided for the years 2021 to 2025, namely –
- Public sector
- Cooperative sector
- Private corporate sector
- Household sector – individuals
- Household sector – others
Definitions for each of the 5 classifications is not provided clearly, and hence we can make a broad assumption that retail credit must fall into the 'household sector – individuals' and 'household sector – others'. We also understand that 'Household Sector – Others' includes non-corporate, non-individual household entities such as proprietorship and partnership firms. For each interest rate bucket, the values add up to 100%.
For each of the classifications, data covers loans falling into 10 interest rate buckets, from 'less than 5%', the first bucket, to '13% and above', the last bucket. The last bucket, of loans priced '13% and above' is not disaggregated further and hence we cannot glean from this public data, what the highest interest rates charged by banks ever might be.
As of March 2025, 79% of outstanding bank loans fell between 7-11% interest rate range, while 7.5% of credit outstanding was priced '13% and above' (See Figure 2). This is not surprising as banks by their very nature must engage in low credit risk business as compared to NBFCs.
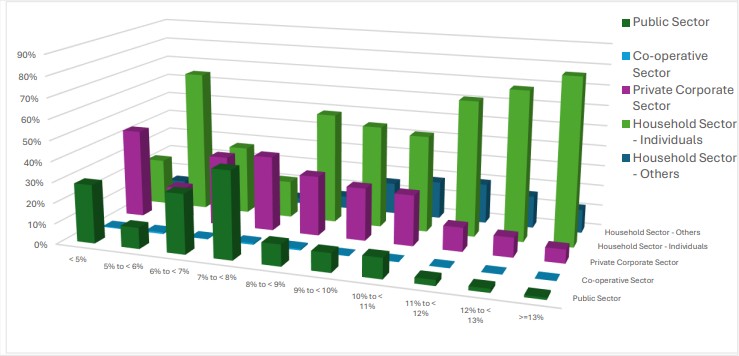
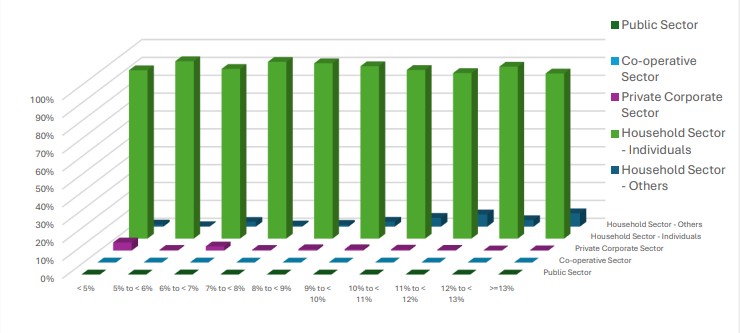
Loans to individuals ('household sector – individuals') formed an overwhelming 94% of the total number of loans and advances (in the dataset4), and 50% of the outstanding credit from banks (see Figure 3). 49% of loans to 'household sector -individuals' were priced 13% and above but accounted for not more than 12% of the credit outstanding to them, as of end-March 2025, indicating that 88% of the credit outstanding to them is priced below 13%, and 2.94% of this is priced below 7% (compared to 4.06% and 5.86% for 'private corporate sector' and 'public sector' respectively.
Microfinance loans on the other hand are typically priced 18% and above, and usually up to 26% per annum5. Banks (including small finance banks) hold 45% of the share of microfinance loans outstanding in India, a close second to NBFCs who hold 52%6.
A closer look at Household-Sector Credit
If we keep aside for a moment, the 'Public Sector', and the 'Cooperative Sector' figures, and consider 'Household Sector – Individuals', 'Household Sector – Others' and 'Private Corporate Sector' as the universe of borrowers that we want to look at, the Figures 4 and 5 capture their relative distributions.
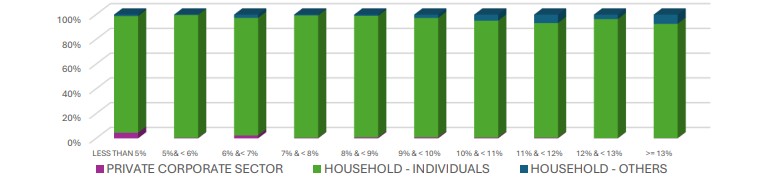
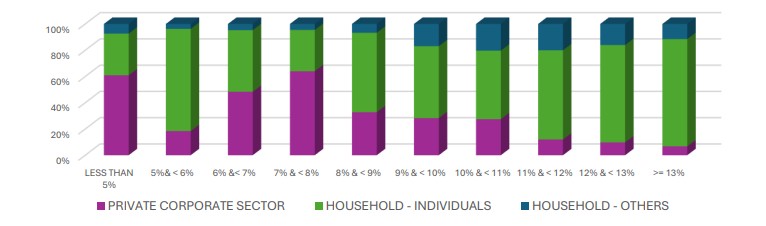
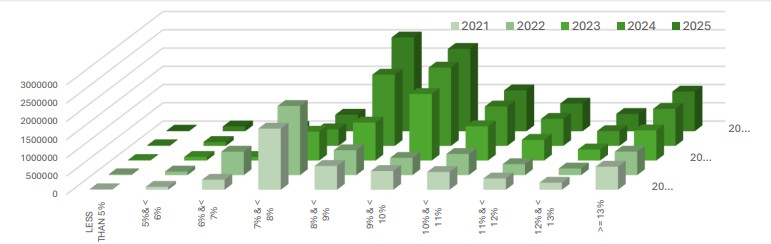
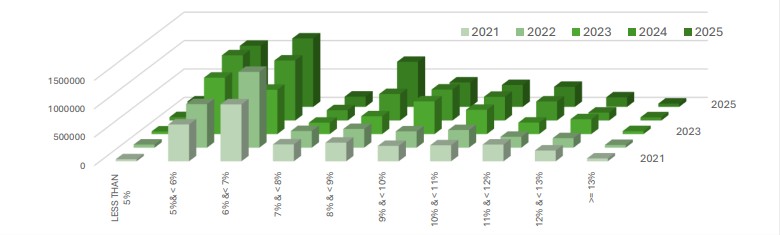
Since data is available for the five years 2021 to 2025, figures 6 to 11 show time trends for the two 'household'-specific sectors, across the number of loan accounts, the credit outstanding in these accounts, and the average loan outstanding per account.
A. Household Sector – Individuals

B. Household Sector – Others
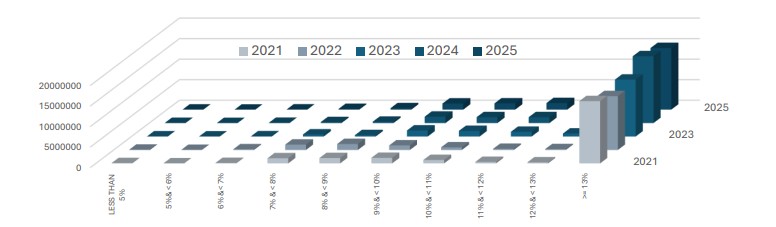

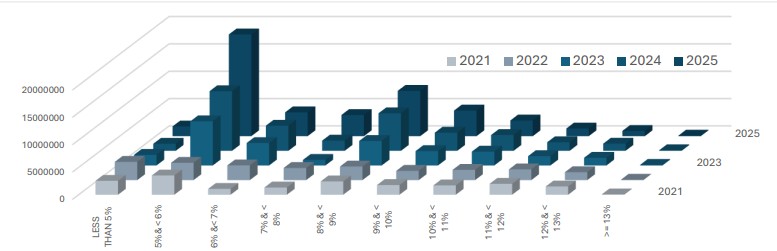
Both 'Household Sector – Individuals' and 'Household Sector -Others' follow similar trends in that loans priced 13% and above formed 47% and 72% of the accounts, but accounted for 12% and 9% of credit outstanding respectively, over the 5 years. Overall, higher the price of the loan, lower the average credit that was outstanding. Banks have likely made smaller ticket loans in the 13% and above bucket.
Growth Rates
Figures 12 and 13 show compound annual growth rates (CAGR) for the number of credit accounts and the credit outstanding for the 5 years for which data is available (2021 to 2025).
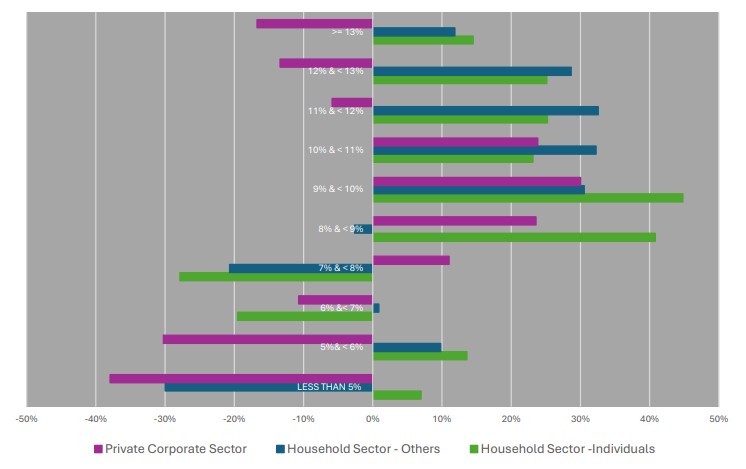
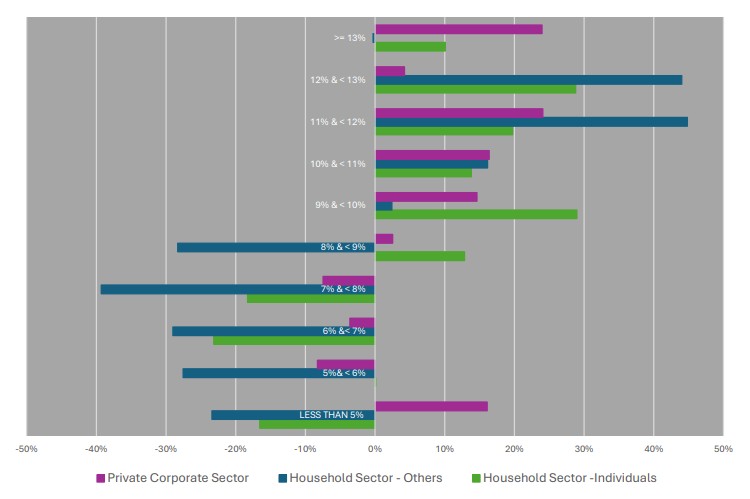
We conclude that India's banking sector has by and large, experienced negative growth rates in the number of loans that have been priced below 8% across the household and private corporate sectors. This might be a direct outcome of the shift from a marginal-cost-of-funds-based determination of base rates to the external benchmark lending rate regime introduced by the RBI in 2019, but this needs to be studied further. Additionally, interest subvention schemes for farmers may be implicated for the loans priced in the 'Less than 5%' and the 5-6% buckets. The anomalous positive CAGR of 16% seen for the private corporate sector loans priced less than 5%, also needs to be studied further before a conclusion can be formed.
By contrast, the banking sector has by and large experienced steady positive growth rates in the number of loans and the quantums of loans outstanding that have been priced between 9%-13% range across all the three sectors under study.
For loans to private corporate sector, priced 11% and above, a positive CAGR over the 5 years, for the number of loans, and a negative CAGR for the quantum outstanding, could indicate that there is a clear shift towards smaller ticket lending to corporates over the years. This further indicates that either smaller corporates have been brought under the fold of formal banking credit, or that existing corporates have been receiving smaller ticket loans from the banking sector. The former implies improvements in credit access while the latter implies tightening of lending to them. According to Transunion CIBIL7, while the share of New-to-Credit (NTC) MSME borrowers to total new loan originations continued to be strong at 47% as of March 2025, it was lower than the share of 51% one year prior. Since data on the proportion of private corporate sector credit that went to NTC borrowers including NTC MSMEs is not publicly available, we cannot conclude what might be happening.
To conclude
While the RBI's dataset analysed here gives some food for thought, many questions remain –
- The need for complete data on loan pricing: What might the loan pricing distribution data look like for NBFCs, cooperative banks, and any other lending entities not included in the dataset? The RBI can publish corresponding interest rate range data for NBFCs in the country, at least for all Middle-Layer and upwards. Combining both these datasets will then make it possible to study the overall spectrum of loan pricing of retail credit in India and allow for monitoring its trends over time.
- Disaggregating pricing beyond the 13% bucket: What might the data look like if we were to disaggregate the '13% and Above' bucket to further buckets of 1% width, all the way up to the highest interest rates recorded in the RBI's supervisory returns? Given that the question of 'usurious' pricing has raised its head many times during the 2021-2025 period, data disaggregated for this, across banks and NBFCs, will help very much to build principles-driven models to inform the presence of usury in the system.
- Parsing through interest rate buckets below EBLR: Understanding what kinds of loans get priced below the EBLR of banks will help to paint a picture of which borrower classes are receiving below EBLR pricing and why. A focused study on the impact of such pricing can be undertaken to establish the efficacy of the policy approaches underlying the origination of these loans.
While the data provides interesting insights, it represents aggregate trends only.
1 Estimated at 1 in 5 jobs across salaried, casual and self-employed. See Employment in India | Data For India, Mar 2024
2 Chart 1.66, Financial Stability Report, RBI, June 2025, data from Transunion CIBIL
3 Table No. 2.3 – Interest rate range and organization-wise classification of outstanding loans and advances of scheduled Commercial Banks, March 2025, Annual Basic Statistical Return (BSR-1) On Credit of Scheduled Commercial Banks in India (including Regional Rural Banks), March 2025, Database on Indian Economy, RBI.
4 We assume that all credit is captured within the 5 sectors for which data has been provided. It is unclear whether there are other sectors not falling under these 5.
5 Best Micro Loans Of 2023: Meaning, Features & How To Apply, Dipen Pradhan, Forbes Advisor, 2023; What are the typical interest rates and repayment terms for microfinance loans?, June 2025
6 See Chart 1.57, Financial Stability Report, RBI, June 2025
7 India's MSME Commercial Credit Portfolio Grew 13% YoY, Transunion CIBIL webpage. 22 May 2025